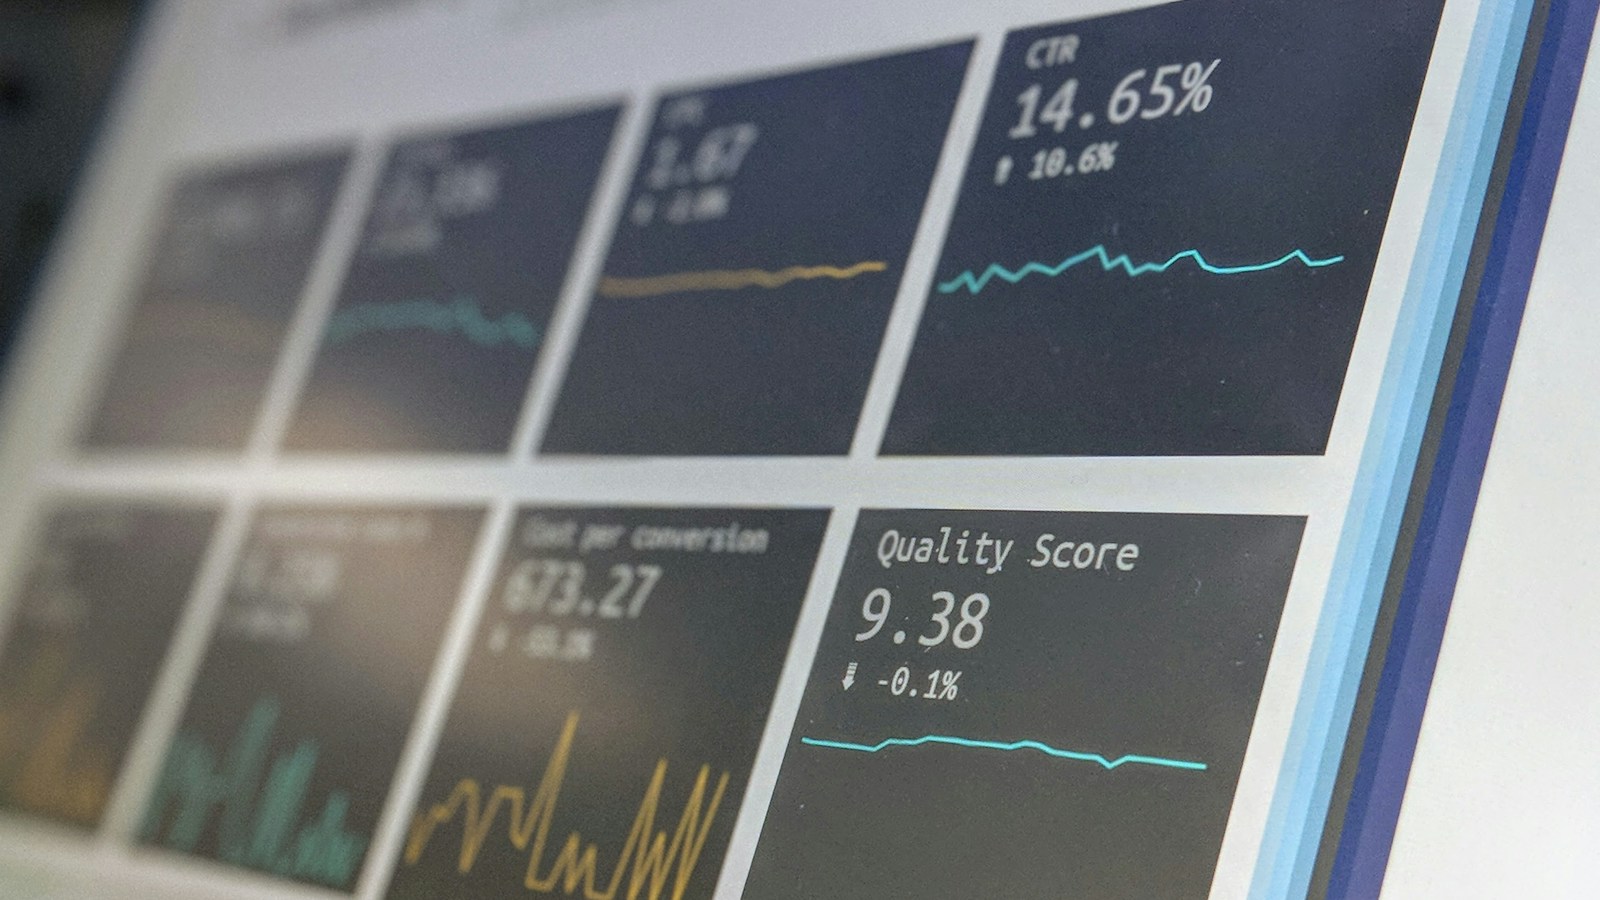
Operations produces more data than any manager can read. The skill is deciding which few numbers should change a decision.
In brief
- Operational data becomes useful when it is tied to a decision a manager actually makes.
- Agree a small set of measures, define them in writing, and show them in one place.
- Most of the work is connecting sources and agreeing meaning, not drawing charts.
- Energy and automotive operations differ in detail, but share the same pattern: many systems, many definitions, and little time.
Plants, fleets, dealers and service centres generate data all day. Management receives a monthly pack that was assembled by hand, arrives late and answers last month’s questions.
The real issue is the distance between data and decision.
Operational systems record events: a reading, a repair, a sale, a delivery. Managers decide things: where to send resources, what to fix, what to stop. Between the two sits a chain of extraction, reconciliation and explanation that is often manual.
From data to decision
| Stage | Question | What good looks like |
|---|---|---|
| Decision | What will a manager do differently with this number? | A short list of recurring decisions |
| Measure | What exactly counts? | A written definition and an owner |
| Source | Where does it come from? | Known systems, matched identifiers |
| Delivery | Where do managers see it? | One place, current, with drill-down to detail |
| Action | What happens next? | A named person and a follow-up |
Patterns that hold across industries
1. Operations have more systems than anyone lists
In both energy and automotive settings, work crosses plant or workshop systems, maintenance records, dealer or customer systems and finance. Each is accurate for its own job. The disagreement appears only when they are combined.
2. Definitions drive trust
“Downtime”, “delivered”, “active customer” and “service visit” can each mean several things. Agreeing the definition removes more argument than any new tool.
3. Fewer measures, better chosen
A page of ten measures that managers read is worth more than a hundred-chart dashboard they ignore.
4. Timeliness matters differently
Some decisions need hourly data, others need a reliable monthly view. Match the refresh rate to the decision, since faster data costs more.
5. Detail on demand
Managers need a headline, and a path to the underlying records when something looks wrong.
Five mistakes we see repeatedly
- Starting with a dashboard tool. Start with decisions.
- Too many measures.
- No agreed definitions.
- Ignoring data entered by hand, which often carries important status.
- Reports without a follow-up owner.
Our experience
We have built shared data foundations for enterprise clients that bring records from several operational platforms into one place, so that management reporting can come from a single source. The practical lesson is the same everywhere: agree the definitions before the charts.
We can explore the decisions your managers make every week and the few measures behind them.
Which monthly report takes the longest to assemble?
Fewer numbers, more decisions
Good management information is short, trusted and tied to action. If your monthly pack takes a week to assemble and changes few decisions, the starting point is the decision list, not another report.
Talk to Balerion about connecting operational data to the decisions your managers make. Email us at talk@balerion.co.th.